- Utah Investor Report
- Posts
- The Canovo Report - February 28, 2024 - SUBS
The Canovo Report - February 28, 2024 - SUBS
🗞️ Canovo Report: Springville 24 unit sells for ~$230k per unit, and avg sold $/sqft up 8.53%

This week in the Canovo Report…
Mortgage rates shoot above 7% with the Fed backtracking on rate cuts, a Springville 24 unit sells for $229k per unit, and the average sold price-per-square-foot for multifamily is up 8.53% year to date.
If you find value in our weekly report, please consider forwarding it to a friend! If this is your first time here, you can subscribe here.
Happy Investing,
David

// NEW MULTIFAMILY LISTINGS THIS WEEK
> Our team has analyzed these properties using our custom bulk property analyzer. If you’d like more detail regarding any of these listings, click the links below.

$370,000
240 N 1400 W Cedar City Utah , 84721
Type: 2
Est Proforma Cap: 4.42%
Total Monthly Expenses: $543.12
Gross Monthly Income: $1,964.00
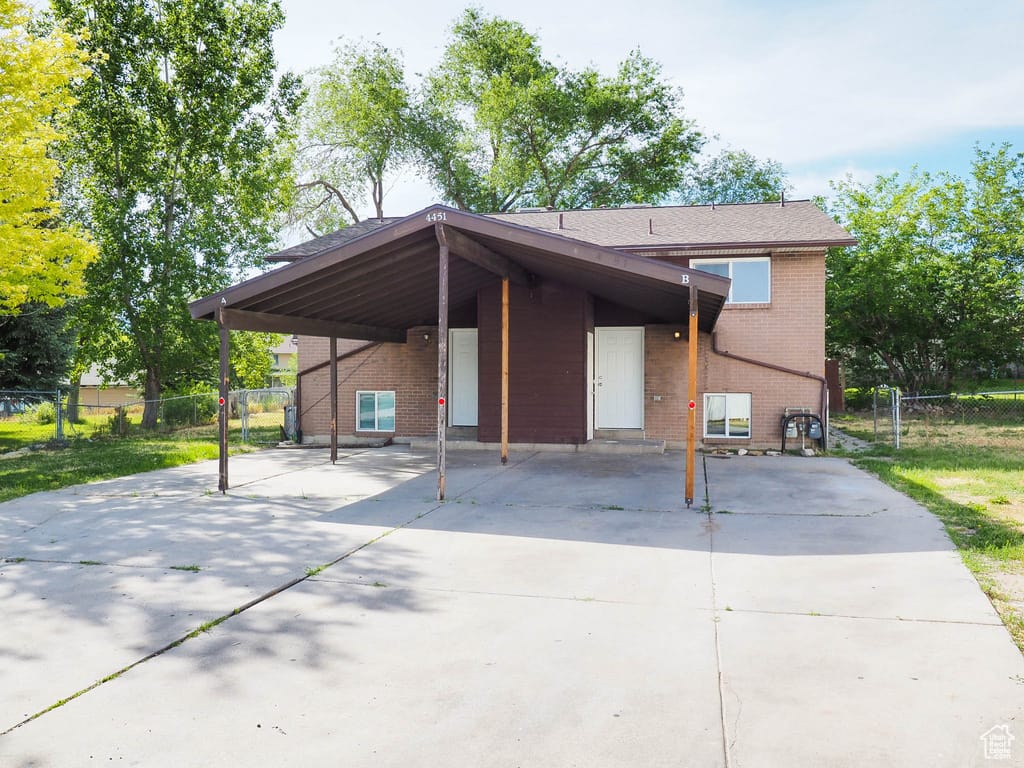
$625,000
4451 S Dean Cir #A-B West Valley City Utah , 84120
Type: 2
Est Proforma Cap: 5.68%
Total Monthly Expenses: $1,038.09
Gross Monthly Income: $4,122.00

$520,000
420 E 600 S Payson Utah , 84651
Type: 2
Est Proforma Cap: 5.41%
Total Monthly Expenses: $842.17
Gross Monthly Income: $3,286.00

$559,000
272 E 200 N Spanish Fork Utah , 84660
Type: 2
Est Proforma Cap: 4.98%
Total Monthly Expenses: $868.36
Gross Monthly Income: $3,286.00
$1,150,000
1430 S Denver St Salt Lake City Utah , 84115
Type: 4
Est Proforma Cap: 4.34%
Total Monthly Expenses: $1,674.82
Gross Monthly Income: $6,016.00

$1,089,000
521 W Tiffany Town Dr Midvale Utah , 84047
Type: 4
Est Proforma Cap: 4.63%
Total Monthly Expenses: $1,633.85
Gross Monthly Income: $6,016.00
Canovo Group may not be the listing brokerage for the above properties. The information provided is not guaranteed and should not be relied upon to make investment decisions. Buyers should complete their own analysis and due diligence before making any investment.

Work with our team to find, analyze, & buy top-performing multifamily property in Utah.

// SOLD LISTINGS LAST WEEK
> Here's a roundup of multifamily properties sold over the past week. We've estimated their selling cap rates using our bulk analyzer.


Is it time to sell? Request a Free Brokers Valuation.

// MARKET SNAPSHOT 2/20/2024
> Below is a report showing data for sold multifamily listings with at least 2 units. The Sold listing count year-to-date sits at 60 which is 27% higher than last year which came in at 47. The Average Sales Price year-to-date is $240, up 8.53% compared to last year which came in at $221.
Multifamily (2+ Units): Sold Listings, Average $/SqFt, and Median $/SqFt

Source: wfrmls

// INTEREST RATES & FINANCING
Sponsored by: Spencer Allen | Trillion Mortgage NMLS #2296408
Mortgage Rates as of 2/27/2024


Source: mortgagenewsdaily.com
Mortgage rates are nearing their highest levels since November 2023, with a slight increase observed, pushing 30-year fixed rates very close to these peaks.
Takeaways:
Rates are close to the highest levels in months, with today's average slightly higher than yesterday's.
The average lender's rate for a top tier, conventional 30-year fixed mortgage is now well into the 7% range, up from around 6.625% at the end of 2023.
Key economic data expected next week could influence rate fluctuations, while upcoming reports may cause some movement depending on their outcomes relative to forecasts.


// TOP NEWS, REPORTS, & INSIGHTS
Utah ranks as the sixth lowest in the country for property tax rates, with an average home tax expense in the United States being $2,869 yearly.
Takeaways:
Utah's property tax rate is .55%, placing it among the states with the lowest property tax rates.
Property tax considerations may indirectly influence where individuals choose to live, factoring into the overall cost of living and home buying costs.
Utah's unique property tax assessment and fluctuation system, including periodic reassessments and adjustments based on market values, can lead to tax shifts affecting homeowners differently.
As of early 2024, Miami leads as America's hottest rental market, with the Midwest showing increased competition due to its economic revitalization and affordability.
Takeaways:
The national Rental Competitiveness Index (RCI) score is 73.4, indicating a moderately competitive rental market with apartments staying vacant for an average of 41 days.
Miami's vibrant economy and attractive lifestyle maintain its position as the most competitive rental market, followed by Milwaukee, which leads the Midwest's surge due to its economic transformation and affordability.
Rising living costs, remote work trends, and high demand in college towns like Fayetteville, AR, intensify rental market competition, with the Midwest claiming a significant portion of the nation’s hottest rental markets due to its cost-effective living and booming job sectors.
Multifamily rent growth is now at 0.5% year-over-year nationally. Another year of weak growth is expected in 2024, largely due to the rapid increase in deliveries that stems from the sector’s strong performance, high liquidity, and favorable treatment in the 2017 tax bill.
Key Points:
Ongoing strong demand is keeping U.S. multifamily rents steady, even as supply growth exerts downward pressure. The average U.S. asking rent was unchanged in January at $1,710, while year-over-year growth rose 10 basis points to 0.5%.
The Northeast and Midwest continue to outperform in the short term. Demand is created by the strong economy and job growth, while large urban markets are benefiting from two years of high immigration inflows.
Single-family rental performance remains robust. U.S. average single-family rents rose $2 in January to $2,130, while year-over-year growth rose 20 basis points to 1.5%. Seven of the top 13metros for rent growth are in the Midwest.

We hope you found this weeks report valuable. If you have any questions, feedback, or if we can serve you in any way, don’t hesitate to reach out!


" target="_blank">unsubscribe