- Utah Investor Report
- Posts
- The Canovo Report - February 21, 2024 - SUBS
The Canovo Report - February 21, 2024 - SUBS
🗞️ Canovo Report: 23-unit sells for ~3.9M, Mortgage rates still elevated on back of Inflation report

This week in the Canovo Report…
Mortgage rates still elevated on back of inflation report; a 23-Unit in Moab sells for ~3.9M…
and…
Active multifamily listings are up 22%.
If you find value in our weekly report, please consider forwarding it to a friend! If this is your first time here, you can subscribe here.
Happy Investing,
David

// NEW MULTIFAMILY LISTINGS THIS WEEK
> Our team has analyzed these properties using our custom bulk property analyzer. If you’d like more detail regarding any of these listings, click the links below.

$875,000
1010 S Windsor St Salt Lake City Utah , 84105
Type: 4
Est Proforma Cap: 5.96%
Total Monthly Expenses: $1,490.11
Gross Monthly Income: $6,016.00

$545,000
514 N Colorado St Salt Lake City Utah , 84116
Type: 2
Est Proforma Cap: 4.62%
Total Monthly Expenses: $817.26
Gross Monthly Income: $3,008.00

$924,900
341 E 950 S Springville Utah , 84663
Type: 4
Est Proforma Cap: 4.11%
Total Monthly Expenses: $1,314.82
Gross Monthly Income: $4,624.00

$725,000
2896 S 625 W Bountiful Utah , 84010
Type: 2
Est Proforma Cap: 4.90%
Total Monthly Expenses: $1,117.86
Gross Monthly Income: $4,206.00
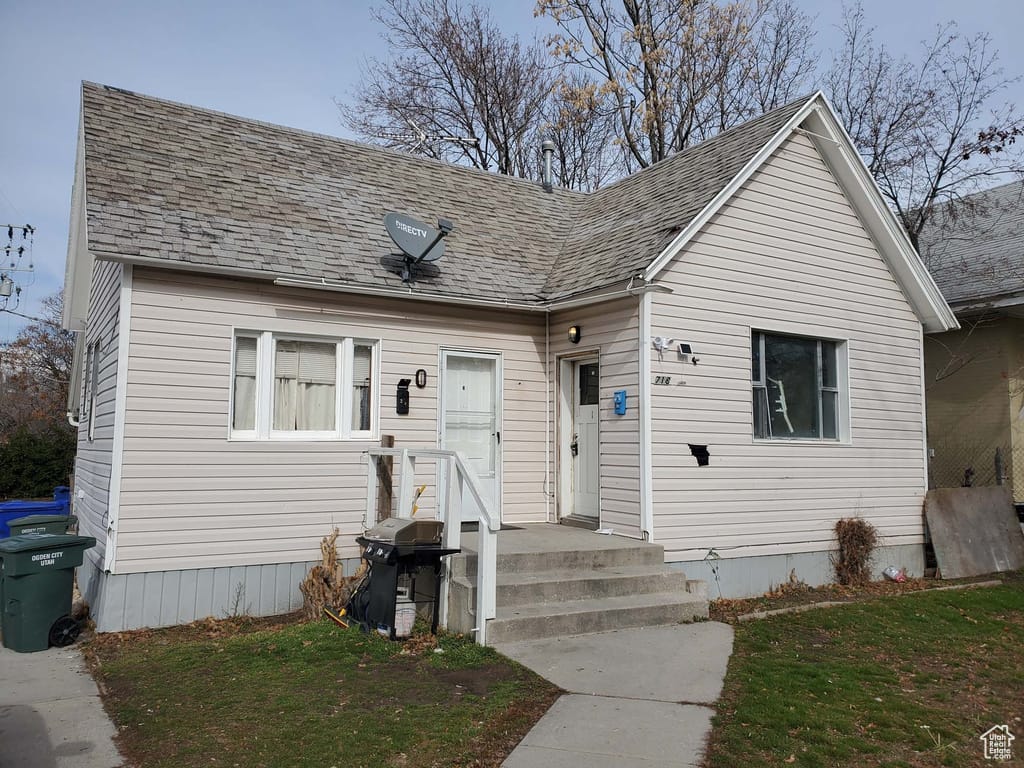
$399,900
718 E 21st St Ogden Utah , 84401
Type: 3
Est Proforma Cap: 6.81%
Total Monthly Expenses: $733.00
Gross Monthly Income: $3,096.00

$555,000
8284 S Wilson St Midvale Utah , 84047
Type: 2
Est Proforma Cap: 4.53%
Total Monthly Expenses: $823.98
Gross Monthly Income: $3,008.00
Canovo Group may not be the listing brokerage for the above properties. The information provided is not guaranteed and should not be relied upon to make investment decisions. Buyers should complete their own analysis and due diligence before making any investment.

Work with our team to find, analyze, & buy top-performing multifamily property in Utah.

// SOLD LISTINGS LAST WEEK
> Here's a roundup of multifamily properties sold over the past week. We've estimated their selling cap rates using our bulk analyzer.


Is it time to sell? Request a Free Brokers Valuation.

// MARKET SNAPSHOT 2/20/2024
> Below is a snapshot of active and under contract listing for both single family and multifamily property. You’ll note that multifamily has 22% more active listings than last year on this day and 23% less under contract.
In contrast, single family has 2% more active listings and 8% less under contract listings than last year on this day.
(source: WFRMLS)
Multifamily Snapshot
The total number of multifamily properties in Active and Under Contract on February 20, 2024 versus 2023.

Single Family Snapshot
The total number of single family properties in Active and Under Contract on February 20, 2024 versus 2023.

Source: wfrmls

// INTEREST RATES & FINANCING
Sponsored by: Spencer Allen | Trillion Mortgage NMLS #2296408
Mortgage Rates as of 2/20/2024


Source: mortgagenewsdaily.com
Mortgage rates have slightly decreased at the beginning of the week due to calm market movements, despite the closure of U.S. banks for a federal holiday.
Takeaways:
Mortgage rates were set for the first time this week on Tuesday, with a slight improvement due to calm market conditions and slight improvements in bonds.
Despite the small decrease, the rates remain near their highest levels in over two months, influenced by recent higher inflation readings.
The potential volatility for mortgage rates this week is lower due to less economic data being released, but rates may not significantly decrease until more influential economic information becomes available..…(more)


// TOP NEWS, REPORTS, & INSIGHTS
The multifamily real estate sector, despite recent challenges, is poised for recovery in 2024, driven by positive trends in rent growth, decreasing expenses, lowering interest rates, and falling cap rates.
Key Takeaways:
Positive Rent Growth Expected: Industry forecasts, such as those from Yardi Matrix, anticipate a rent increase of 1.5% in 2024, suggesting a rebound from previous downturns.
Expenses Growth Slowing Down: While expenses are not expected to decrease this year, the growth rate is likely to align more closely with historical averages, especially with CPI inflation nearing 3%.
Interest and Cap Rates Declining: Economists and the Federal Reserve predict a decrease in interest rates, which, along with significant investor capital on the sidelines, could lead to lower mortgage rates and cap rates, further stimulating the multifamily market.
This analysis counters previous pessimistic views, presenting a more optimistic outlook for the multifamily sector, underpinned by data indicating a shift towards recovery and growth in 2024.
The number of single-family homes built specifically for rent has nearly doubled from 2020 to 2023, indicating a growing trend in the housing market towards rental properties.
Key Points:
Dramatic Increase in Built-for-Rent Single Family Homes: From 2020 to 2023, single-family units intended for rent rose from 44,000 to 85,000, showcasing significant growth in this sector.
Multi-family and Single-family Starts: While multi-family units started for rent also increased from 327,000 in 2020 to 393,000 in 2023, the percentage of single-family units in the built-for-rent category grew to 18% in 2023.
Completions and Market Trends: Built-for-rent completions increased by 21% year-over-year in Q4 2023, with a near record number of multi-family units under construction, suggesting that the supply of rental units is likely to grow further in 2024, impacting rent dynamics.
This shift highlights a significant movement towards rental housing, particularly in the single-family segment, reflecting changing preferences and market dynamics in the U.S. housing sector.
January witnessed a notable decline in multifamily construction starts, with a 35.6% drop to the lowest level since the pandemic began, although permits for single-family homes saw an increase.
Key Points:
Sharp Decline in Multifamily Starts: The multifamily sector saw a drastic decrease in construction starts, falling to an annualized pace of 327,000 units, contributing to an overall 14.8% drop in housing starts.
Regional Variances in Starts and Permits: All regions experienced declines in housing starts, with varying impacts on permits; the Northeast and Midwest saw permit increases, while the South and West witnessed declines.
Stable Single-Family Construction and Future Optimism: Despite the decrease in multifamily starts, single-family construction remained stable, and there's optimism for the sector's recovery, partly due to potential Federal Reserve interest rate cuts and increased confidence among home builders.
The significant downturn in multifamily construction starts contrasts with the slight improvement in single-family permits, indicating a mixed outlook for the housing construction sector at the beginning of the year.
In Utah, new legislative measures are being introduced to streamline the home approval and building process, aiming to alleviate the state's housing affordability crisis.
We hope you found this weeks report valuable. If you have any questions, feedback, or if we can serve you in any way, don’t hesitate to reach out!


" target="_blank">unsubscribe